
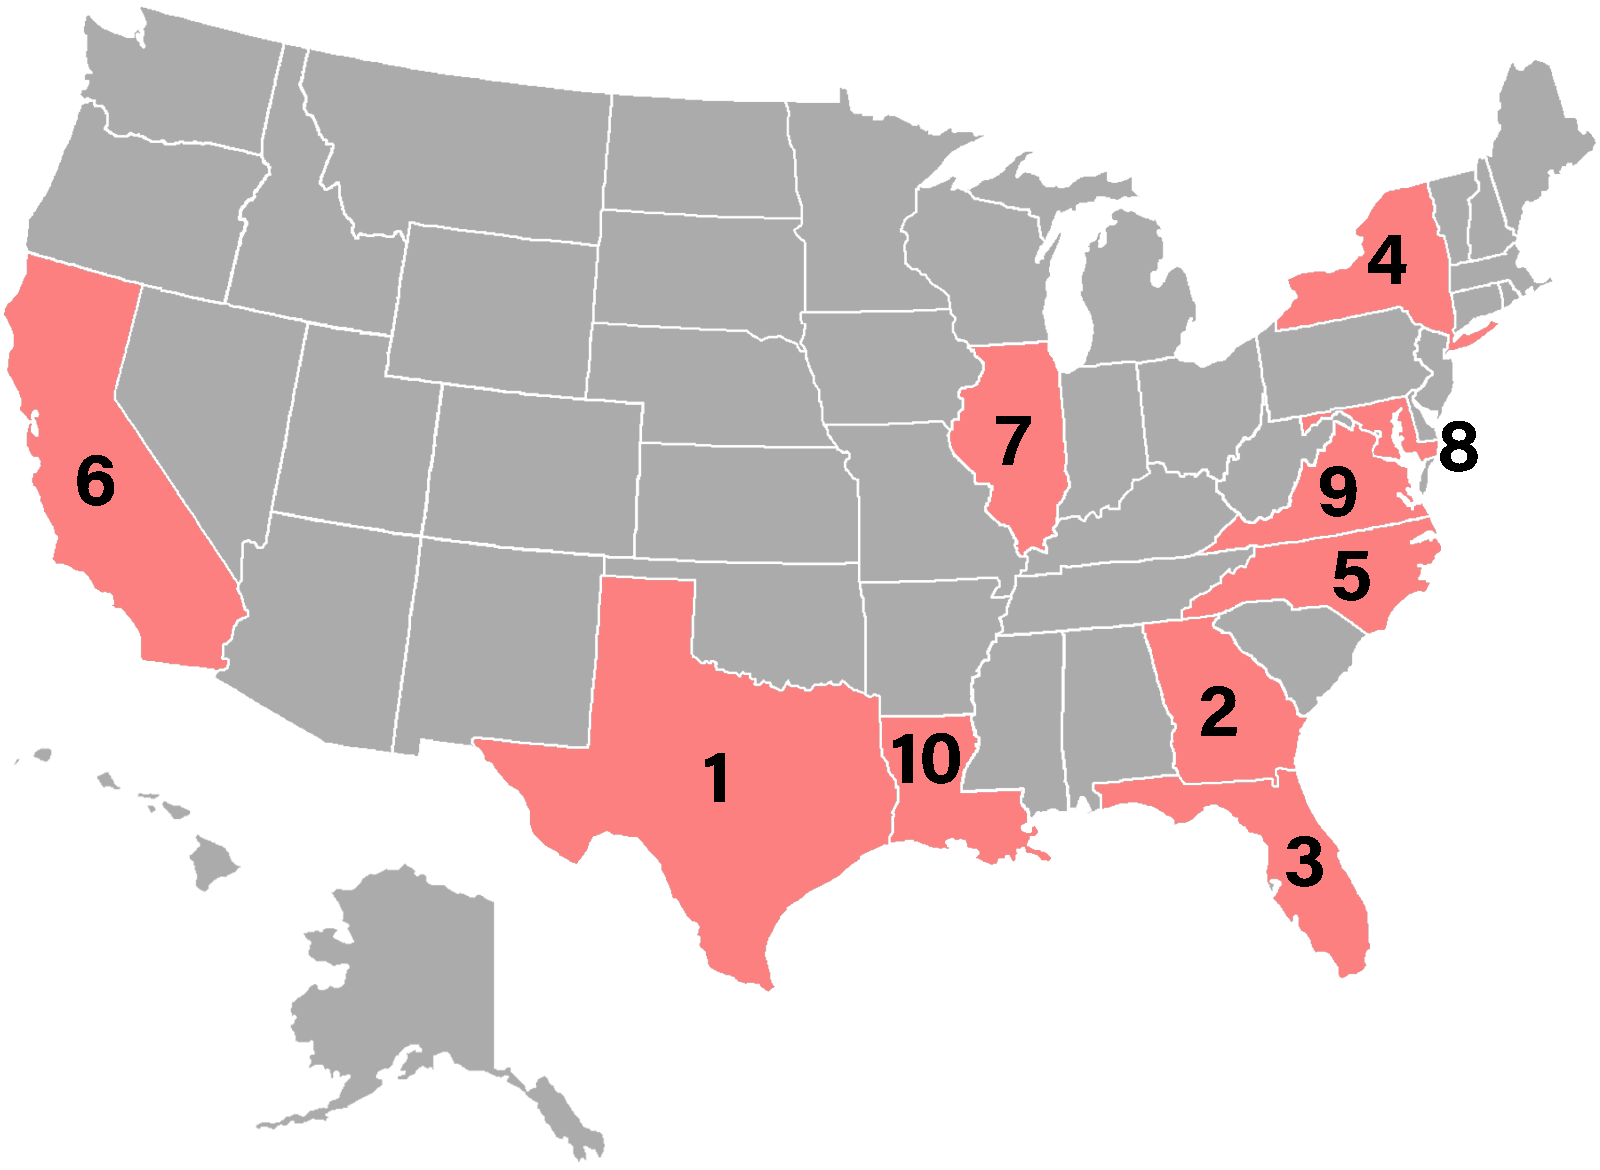
Overview (Demographics): In July 2017, 41.4 million people in the United States were black alone, which represents 12.7 percent of the total population. African Americans are the second largest minority population, following the Hispanic/Latino population. In 2017, most blacks lived in the South (58 percent of the black U.S. population), while 27 percent of the white population lived in the South. The ten states with the largest black population in 2017 were Texas, Georgia, Florida, New York, North Carolina, California, Illinois, Maryland, Virginia, Louisiana. Combined, these 10 states represent 58% of the total black population.
Educational Attainment: In 2017, as compared to non-Hispanic whites 25 years and over, 86.0 percent of non-Hispanic blacks had earned at least a high school diploma, as compared to 92.9 percent of the non-Hispanic white population. 21.4 percent of non-Hispanic blacks had a bachelor's degree or higher, as compared with 35.8 percent of non-Hispanic whites. More black women than black men had earned at least a bachelor's degree (23.8 percent compared with 18.5 percent), while among non-Hispanic whites, a higher proportion of women than men had earned at least a bachelor's degree (35.9 percent and 35.6 percent, respectively). 8.1 percent of non-Hispanic blacks have a graduate or advanced professional degree, as compared to 13.8 percent of the non-Hispanic white population.
Economics: According to the Census Bureau in 2017, the average non-Hispanic black median household income was $40,165 in comparison to $65,845 for non-Hispanic white households. In 2017, the U.S. Census Bureau reported that 22.9 percent of non-Hispanic blacks in comparison to 9.6 percent of non-Hispanic whites were living at the poverty level. In 2017, the unemployment rate for blacks was twice that of non-Hispanic whites (9.5 percent and 4.2 percent, respectively).
Insurance Coverage: In 2017, 55.5 percent of non-Hispanic blacks in comparison to 75.4 percent of non-Hispanic whites used private health insurance. Also in 2017, 43.9 percent of non-Hispanic blacks in comparison to 33.7 percent of non-Hispanic whites relied on Medicaid or public health insurance. Finally, 9.9 percent of non-Hispanic blacks in comparison to 5.9 percent of non-Hispanic whites were uninsured.
Health: According to Census Bureau projections, the 2015 life expectancies at birth for blacks are 76.1 years, with 78.9 years for women, and 72.9 years for men. For non-Hispanic whites the projected life expectancies are 79.8 years, with 82.0 years for women, and 77.5 years for men. The death rate for African Americans is generally higher than whites for heart diseases, stroke, cancer, asthma, influenza and pneumonia, diabetes, HIV/AIDS, and homicide.